
Last updated: Oct 17, 2026
Hourly Wage to Annual Income Calculator
Federal tax. Card 3 uses 2026 IRS inflation-adjusted brackets and standard deductions ($16,100 single, $32,200 married filing jointly, $24,150 head of household).
Payroll tax. Social Security is 6.2% up to the $184,500 2026 wage base. Medicare is 1.45%, plus 0.9% above $200,000 (single) or $250,000 (joint).
Overtime and hours. The US Fair Labor Standards Act sets overtime at 1.5 times pay above 40 hours for covered non-exempt workers. Payroll teams use 2,080 hours as the standard year.
State data. State tax rates and cost-of-living indexes (US average = 100) are rounded approximations for planning. Local taxes, credits and itemized deductions are not modeled.
Hourly Wage to Annual Income Calculator (2026)
Last updated: October 2026
Published by: Intel Calculator. Read how we review content on our editorial policies page and learn more about Intel Calculator and our team.
At 40 hours a week for 52 weeks, $25 an hour equals $52,000 a year before taxes. This hourly wage to annual income calculator turns any hourly rate into yearly, monthly, bi-weekly, weekly and daily pay. Think of it as an hourly to yearly pay converter: enter your rate, your weekly hours and the weeks you work, and you get your annual income, also called income per annum, in seconds.
This tool goes further than a basic hourly to salary calculator. It also handles overtime, 2026 taxes, commuting costs, raises, job offers, time off, budgets, state costs and retirement savings. Use it if you are comparing job offers, planning a budget, applying for a lease or checking a raise.
These calculators convert pay between hourly, weekly, monthly and annual figures and estimate overtime, take-home pay and raises, so you can compare jobs and plan a budget with one set of numbers. If you start from a yearly figure instead, use the salary to hourly calculator.
Knowing your annual income matters because most big money decisions use it. Lenders, landlords and tax forms all ask for yearly pay. Your hourly rate alone does not answer those questions.
Quick Answer: How to Convert Hourly Pay to Annual Income
To convert hourly pay to annual income, multiply your hourly wage by your weekly hours, then by the weeks you work in a year. At $25 an hour, 40 hours a week and 52 weeks a year, the result is $52,000.
Annual income = Hourly wage × Hours per week × Weeks per year
A full-time worker usually works 40 hours for 52 weeks. That equals 2,080 paid hours. Multiplying by those hours is how you annualize an hourly wage, which means you express it as a yearly amount. The same logic answers the question “how much is an hourly wage per year?”: it depends on three inputs, which are the rate, the hours and the weeks.
Rule of thumb: double your hourly rate and add three zeros. At $25 an hour, that gives about $50,000. The exact answer is $52,000, so use the calculator when accuracy matters.
| Hourly wage | Annual income (2,080 hours) | Monthly | Bi-weekly |
| $12 | $24,960 | $2,080 | $960 |
| $15 | $31,200 | $2,600 | $1,200 |
| $18 | $37,440 | $3,120 | $1,440 |
| $20 | $41,600 | $3,467 | $1,600 |
| $25 | $52,000 | $4,333 | $2,000 |
| $30 | $62,400 | $5,200 | $2,400 |
| $35 | $72,800 | $6,067 | $2,800 |
| $40 | $83,200 | $6,933 | $3,200 |
| $50 | $104,000 | $8,667 | $4,000 |
| $60 | $124,800 | $10,400 | $4,800 |
At 2,080 hours a year, $15 an hour equals $31,200, $25 an hour equals $52,000 and $50 an hour equals $104,000 before taxes. These figures are gross pay. Gross pay is your income before taxes and deductions. To see any of these yearly totals as a monthly figure, use the monthly income calculator.
Five common conversions at 40 hours a week answer the most typical long-tail questions:
- $15 an hour is how much a month? $15 an hour is $2,600 a month and $31,200 a year.
- $18 an hour at 40 hours a week: $18 × 40 = $720 a week, which is $37,440 a year.
- $20 an hour is how much a year? $20 an hour is $41,600 a year, or about $3,467 a month.
- $25 an hour annual salary: $25 an hour equals $52,000 a year before taxes.
- $30 an hour yearly after taxes: $30 an hour is $62,400 gross and about $52,318 after federal and payroll tax for a single filer in Texas (see the take-home section below).
Who Should Use This Hourly to Salary Calculator
You should use this hourly to salary calculator if you earn by the hour and need a yearly figure. It also helps if you are comparing an hourly job with a salaried one. Think of it as a wage to salary converter that keeps your real hours and weeks in the math.
Common users include:
- Job seekers weighing two offers
- Part-time and shift workers planning a budget
- Renters and borrowers who must report annual income
- Workers deciding whether overtime is worth the extra hours
- Anyone asking, “How much is $X an hour per year?”
For a simple yearly total, try the annual income calculator or the annual salary calculator.
Salary to Hourly: What $30,000 to $100,000 a Year Pays per Hour
Salary to hourly conversion divides the yearly figure by 2,080 hours. A $60,000 salary equals about $28.85 an hour. That answers “what hourly wage equals $60,000 a year?” in one step.
| Annual salary | Hourly rate at 2,080 hours |
| $30,000 | $14.42 |
| $40,000 | $19.23 |
| $50,000 | $24.04 |
| $60,000 | $28.85 |
| $75,000 | $36.06 |
| $100,000 | $48.08 |
Divide the yearly figure by 2,080: a $60,000 salary is about $28.85 an hour. Use the salary to hourly calculator for exact figures with your own hours.
Wage, Salary and Income: What Is the Difference?
Wage, salary and income describe three different things. Each term answers a different question about money earned from work.
- Wage: pay for each hour or unit of work. Overtime usually applies.
- Salary: a fixed amount per year, paid regardless of hours. It is often paid to exempt employees.
- Income (annual income, income per annum, annualized pay): all money received in a year. For this calculator, it means gross earnings before taxes.
Converting hourly pay to annual pay, hourly rate to salary or wage to salary all use one idea. You turn a rate per hour into a total per year. The result is annualized pay. It is a gross number until you subtract taxes and deductions.
How to Use the Calculator: Every Card Explained (Card 1 to 12)
The calculator has 12 cards. Each card works alone. When you calculate one card, its key results fill the matching inputs in later cards. A blue border and an “Auto-filled” badge mark those values, and you can change any of them.
Each card has three buttons. Calculate shows results below the card. Fill Example loads sample values. Reset clears only that card.
- Card 1: Basic Hourly to Annual Income
- Card 2: Overtime and Extra Hours
- Card 3: 2026 Take-Home Pay and Tax Estimate
- Card 4: True Hourly Wage After Work Costs
- Card 5: Raise and Inflation Projection
- Card 6: Wage and Hours Heatmap with Target Rate
- Card 7: Job Offer Comparison
- Card 8: Paid Time Off and Holiday Impact
- Card 9: Hours Versus Income Planner
- Card 10: Take-Home Budget Planner
- Card 11: State Cost-of-Living Purchasing Power
- Card 12: Lifetime Earnings and Retirement Savings
Card 1: Basic Hourly to Annual Income
This is the core conversion tool. It turns hourly wage into annualized pay.
Inputs: hourly wage (your pay before taxes); hours per week (1 to 80, in half-hour steps); weeks worked per year (1 to 52, fewer if you take unpaid time off); days worked per week (used only to find daily pay).
Outputs: annual gross income, monthly income, weekly and daily pay, the standard 2,080-hour figure and total hours worked. A table lists every pay period, and a chart shows your earnings building month by month. Amounts round to the cent, so monthly pay at $52,000 shows as $4,333.33.
Formula: Annual = Rate × Hours × Weeks. Monthly = Annual ÷ 12. Bi-weekly = Annual ÷ 26.
Card 2: Overtime and Extra Hours
This card adds overtime to your regular pay.
Inputs: hourly wage, regular hours, overtime hours, overtime multiplier and weeks worked. Multipliers run from 1x to 3x. Time and a half is 1.5x, and double time is 2x.
Outputs: total annual pay, overtime pay, your effective hourly average and the share of income that comes from overtime.
Formula: Overtime pay = Rate × Multiplier × Overtime hours × Weeks. To see overtime in detail, use the overtime pay calculator. The time and a half calculator covers the 1.5x case.
Card 3: 2026 Take-Home Pay and Tax Estimate
This card estimates what lands in your bank account.
Inputs: annual gross income, filing status (single, married filing jointly or head of household), your state and your 401(k) contribution rate.
Outputs: take-home pay, federal income tax, Social Security and Medicare tax, state tax, total tax burden and a flow chart of where your pay goes. It uses 2026 federal brackets and standard deductions. For a per-paycheck view, use the paycheck calculator. For a deeper gross-to-net breakdown, try the gross to net calculator.
Card 4: True Hourly Wage After Work Costs
Your posted wage is not what an hour of your time earns. This card subtracts commuting and work costs.
Inputs: hourly wage, hours, weeks, commute hours per week, commute cost per week and yearly work expenses such as uniforms. If you drive, the fuel cost calculator gives a weekly commute figure.
Outputs: true hourly wage, hourly value lost, yearly cost of working and total hours given to work.
Formula: True hourly = (Annual pay − Costs) ÷ (Work hours + Commute hours).
Card 5: Raise and Inflation Projection
This card shows future pay and what it will really buy.
Inputs: current annual income, yearly raise, inflation rate and years to project.
Outputs: future salary, its value in today’s dollars, total earnings over the period, real growth and years to double your pay. Try the pay raise calculator or the future salary calculator for related views.
Card 6: Wage and Hours Heatmap with Target Rate
This card answers two questions. What do different wage and hour combinations pay? What hourly rate reaches my target income?
Inputs: hourly wage, wage step, hours, weeks and target income.
Outputs: the hourly wage needed for your target, your current income, the gap, the value of a $1 raise and the value of one extra weekly hour.
Sensitivity example: a $1 raise adds $2,080 a year at 40 hours a week. One extra weekly hour at $25 an hour adds $1,300 a year at regular pay. At time and a half, that same hour adds $1,950.
Card 7: Job Offer Comparison
Compare two hourly offers, including benefits.
Inputs: wage, weekly hours and yearly benefits value for each offer, plus weeks worked.
Outputs: total pay for each offer, the winner and the better value per hour. A radar chart compares both offers on five measures. The case study below shows the method with real numbers.
Card 8: Paid Time Off and Holiday Impact
This card shows what vacation, sick days and holidays are worth.
Inputs: wage, hours, days per week, paid vacation days, paid sick days and paid holidays.
Outputs: dollar value of paid time off, days actually worked, pay per day worked and weeks of paid leave.
Card 9: Hours Versus Income Planner
Find out how extra hours change your income.
Inputs: wage, planned hours, the hour when overtime starts, overtime multiplier, weeks and a target income.
Outputs: income at your planned hours, average hourly pay, overtime premium, hours needed for your target and the value of one more hour.
Card 10: Take-Home Budget Planner
This card splits take-home pay into needs, wants and savings.
Inputs: annual take-home pay, needs share and wants share. Savings is whatever remains.
Outputs: monthly take-home, needs, wants and savings amounts, plus a savings-rate bar. Pair it with the rent budget calculator or the rent affordability calculator.
Card 11: State Cost-of-Living Purchasing Power
Compare how far your pay goes in two states.
Inputs: gross income, your current state and a comparison state. The lists cover all 50 states and Washington, DC.
Outputs: the salary you need in the new state to keep your buying power, the change in purchasing power, take-home pay in each state and adjusted buying power.
Card 12: Lifetime Earnings and Retirement Savings
See how wages become a retirement fund.
Inputs: current income, working years left, yearly raise, share of pay saved and expected investment return.
Outputs: projected fund, lifetime gross earnings, total contributed, investment growth and income at a 4% withdrawal rate. For more planning, use the retirement calculator, the safe withdrawal rate calculator or the 401(k) calculator.
The Core Formula and the 2,080-Hour Standard
Most payroll teams treat a full-time year as 2,080 hours. That comes from 40 hours a week for 52 weeks.
Is 2,080 Hours Accurate? Why Employers Use It
A standard full-time work year has 2,080 paid hours. Employers use 2,080 because 40 hours a week times 52 weeks equals 2,080. The number counts paid hours, so it already includes paid holidays and paid vacation. Payroll teams like it because it makes salary and hourly offers easy to compare.
The number is a convention, not a calendar fact. A calendar year has 365 days, which is 52 weeks plus one day. In 2026, that extra day falls on a Thursday. The year has 261 weekdays, which is 2,088 hours at 8 hours a day. The weekday calculator can confirm the count for any year.
The gap is only 8 hours. At $25 an hour, it is $200. Most employers still use 2,080, so the calculator does too.
Hourly Wage to Annual Income: 2,080 vs 2,087 vs 2,088 Hours
There are three common hour conventions. The U.S. Office of Personnel Management uses 2,087 hours for federal hourly rate conversions. That figure comes from 365.25 days divided by 7, multiplied by 40. The calendar-exact count for 2026 is 261 weekdays times 8 hours, or 2,088 hours.
| Convention | Hours per year | Annual pay at $25 an hour | Where it is used |
| Standard payroll year | 2,080 | $52,000 | Most private employers and offer comparisons |
| Federal government convention | 2,087 | $52,175 | U.S. federal hourly-to-annual conversion |
| 2026 weekdays × 8 hours | 2,088 | $52,200 | Calendar-exact planning for 2026 |
At $25 an hour, the three conventions differ by only $175 to $200 a year. Use 2,080 for job comparisons and your actual hours and weeks for your own budget.
Comparison: Three Ways to Convert Hourly to Annual
| Method | Formula | Best use |
| Standard year | Rate × 2,080 | Quick comparisons with salary offers |
| Actual weeks | Rate × Hours × Weeks worked | Real income with unpaid time off |
| 2026 weekdays | Rate × 8 × 261 | Exact weekday count for 2026 |
The standard-year method uses 2,080 hours, the actual-weeks method uses your real hours and weeks, and the 2026 weekday method uses 8 hours times 261 days, which is 2,088 hours. Use the standard year to compare jobs. Use actual weeks to plan your own budget. Use the weekday method when you need the exact 2026 calendar.
How Pay Periods Change Your Paycheck
The same annual pay splits differently across pay schedules.
| Pay schedule | Paychecks per year | Gross pay at $52,000 a year |
| Weekly | 52 | $1,000.00 |
| Bi-weekly | 26 | $2,000.00 |
| Semi-monthly | 24 | $2,166.67 |
| Monthly | 12 | $4,333.33 |
A $52,000 salary pays $1,000 weekly, $2,000 bi-weekly, $2,166.67 semi-monthly and $4,333.33 monthly. Bi-weekly checks arrive every two weeks. Semi-monthly checks arrive twice a month, so they are not the same as bi-weekly ones. The biweekly overtime calculator helps with that schedule.
Why some years have 27 bi-weekly checks. A year has 52 weeks plus one or two days. In a non-leap year such as 2026, a bi-weekly schedule gets 27 paydays only if the first payday falls on January 1. In 2026, that is a Thursday. Weekly schedules also gain a 53rd payday on Thursdays. Ask payroll whether salaried checks are divided by 26 or 27. Hourly pay is paid for the hours worked in each period.
Practical Examples With Step-by-Step Math (Examples 1 to 9)
There are nine worked examples below. Each one uses the same formula: Rate × Hours × Weeks.
Example 1: Full-Time Worker at $25 an Hour
- Weekly pay: $25 × 40 = $1,000.
- Annual pay: $1,000 × 52 = $52,000.
- Monthly pay: $52,000 ÷ 12 = $4,333.33.
- Bi-weekly pay: $52,000 ÷ 26 = $2,000.
Example 2: Part-Time Worker at $18 an Hour
A part-timer works 25 hours a week for 52 weeks.
- Weekly pay: $18 × 25 = $450.
- Annual pay: $450 × 52 = $23,400.
Example 3: Two Unpaid Weeks
Take the $25 worker from Example 1 and remove two unpaid weeks.
- Annual pay: $25 × 40 × 50 = $50,000.
Two weeks without pay cost $2,000. This is why the weeks input matters. Use the working days calculator to count your real work days.
Example 4: Overtime at $28 an Hour
A worker earns $28 an hour, works 40 regular hours plus 8 overtime hours at 1.5x, and works 50 weeks.
- Regular pay: $28 × 40 × 50 = $56,000.
- Overtime pay: $28 × 1.5 × 8 × 50 = $16,800.
- Total: $72,800.
- Effective hourly average: $72,800 ÷ (48 × 50) = $30.33.
Overtime makes up 23% of total pay and raises pay by 30% over regular pay. It also takes 400 extra hours of work.
Example 5: From Gross Pay to Take-Home
Using the calculator’s Card 3, take a single filer earning $52,000 in Texas who saves 5% in a 401(k).
- 401(k) contribution: $2,600.
- Taxable income: $52,000 − $2,600 − $16,100 standard deduction = $33,300.
- Federal tax: 10% of $12,400 plus 12% of $20,900 = $3,748.
- Social Security: $52,000 × 6.2% = $3,224.
- Medicare: $52,000 × 1.45% = $754.
- State tax: $0, since Texas has no state income tax.
- Take-home pay: $41,674, or about $3,473 a month.
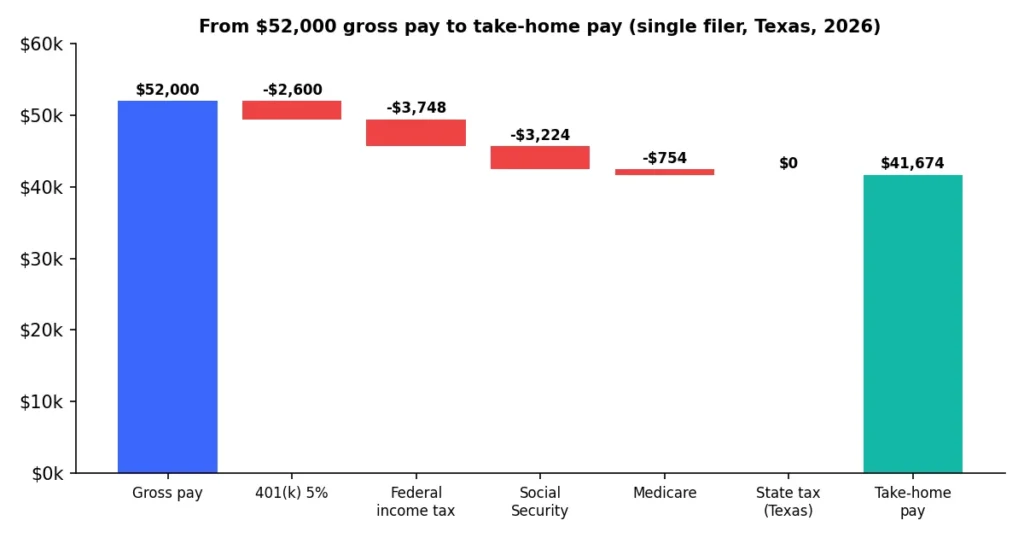
Federal tax is only 7.2% of gross pay here, even though the highest bracket this worker reaches is 12%.
Figure 1. Where $52,000 of gross pay goes for a single filer in Texas (2026).
Example 6: The True Hourly Wage
Take the $25 worker. The commute is 5 hours a week and costs $40 a week. Work expenses are $1,200 a year.
- Costs: $40 × 52 + $1,200 = $3,280.
- Pay after costs: $52,000 − $3,280 = $48,720.
- Hours given: 45 × 52 = 2,340.
- True hourly wage: $48,720 ÷ 2,340 = $20.82.
A $25 job pays $20.82 for each hour it takes from your life.
Example 7: Irregular or Seasonal Hours
What if my hours change every week? Many hourly workers face this, because seasons, shift swaps and slow periods all move the total. A single week then misleads you, so annualize from a full year of paid hours instead. A worker earning $22 an hour was paid for 1,560 hours over the last 12 months.
- Weekly average: 1,560 ÷ 52 = 30 hours.
- Annual pay: $22 × 30 × 52 = $34,320.
Use a trailing 12-month total instead of a single week. The time to decimal calculator turns shifts such as 7:45 into decimal hours so the totals add up cleanly.
Example 8: Two Jobs
- Job one: $18 × 25 hours × 52 weeks = $23,400.
- Job two: $15 × 20 hours × 52 weeks = $15,600.
- Combined annual income: $39,000, or $3,250 a month.
Taxes are based on the combined total. To find one average rate across both jobs, use the blended rate calculator.
Example 9: 1099 Contractor at $25 an Hour
- Gross pay: 40 hours × 50 weeks × $25 = $50,000.
- Business expenses: $3,000, so net earnings are $47,000.
- Self-employment tax: $47,000 × 0.9235 × 0.153 = about $6,641.
An employee with the same $50,000 pays 7.65% in FICA, or $3,825. The employer pays the other half. Self-employed workers can deduct half of their self-employment tax, but contractors usually need a higher hourly rate to match employee take-home. The bill rate calculator helps you set that rate.
Pro Tips and Common Mistakes
Pro Tips
- Use actual weeks worked, not 52, if you take unpaid leave.
- Compare job offers on total compensation, not wage alone. Divide total compensation by hours worked, as in the case study below.
- Add commute time before you compare two jobs.
- Treat overtime as bonus income, and budget from regular pay.
- Round your hours to the nearest half hour for easier math.
- Recalculate each time you get a raise or change your hours.
- Remember the sensitivity numbers: a $1 raise adds $2,080 a year at 40 hours, and one extra weekly hour at $25 adds $1,300 a year.
Common Mistakes
- Forgetting unpaid time off. It can quietly cut income by thousands.
- Using gross pay for rent. Landlords may use gross pay, but your budget should use take-home pay.
- Counting paid time off as extra income. Paid leave is already part of your yearly pay.
- Ignoring benefits. A $5,000 health plan difference equals a $2.40 hourly raise at 2,080 hours.
- Mixing up bi-weekly and semi-monthly. They produce 26 and 24 checks.
- Applying full-time numbers to part-time schedules. Use the part-time table in the next section instead.
Warning: do not use calculator output as tax filing figures. Credits, itemized deductions and local taxes are not included.
Best practice: refresh tax figures every January and after any IRS or Social Security Administration announcement. Update the last-updated line each time.
Part-Time Hourly Pay per Year (20 to 35 Hours a Week)
Part-time hourly pay per year equals hourly wage times weekly hours times 52 weeks. A worker at $20 an hour who works 25 hours a week earns $26,000 a year. That answers the common query “part-time 25 hours per week yearly pay” for a $20 wage.
| Hours per week | At $15 an hour | At $20 an hour | At $25 an hour |
| 20 | $15,600 | $20,800 | $26,000 |
| 25 | $19,500 | $26,000 | $32,500 |
| 30 | $23,400 | $31,200 | $39,000 |
| 32 | $24,960 | $33,280 | $41,600 |
| 35 | $27,300 | $36,400 | $45,500 |
All values assume 52 paid weeks before taxes. For example, $20 an hour at 25 hours a week equals $26,000 a year.
Common mistake: a $20 wage at 20 hours a week pays $20,800, not $41,600. Part-time hourly to annual pay is half of the full-time figure when hours are halved.
For partial years, use the prorated salary calculator. To check weekly hours against a monthly total, the hours to weeks conversion tool turns total hours into weeks.
Minimum Wage Annualized: Federal and State Examples
The federal minimum wage of $7.25 an hour equals $15,080 a year at 2,080 hours. At 20 hours a week, it equals $7,540 a year. The rate has stayed at $7.25 since 2009. This is the minimum wage annual income benchmark for full-time work.
Many states set higher minimums. To annualize your state minimum, multiply it by your weekly hours and weeks worked, or by 2,080 for full time. A hypothetical state minimum of $15.00 an hour equals $31,200 a year. Check your state’s current rate with the Department of Labor state minimum wage table before you calculate.
Tipped workers have a different federal floor. The federal cash wage for tipped employees is $2.13 an hour under 29 U.S.C. 203(m), and tips must bring pay up to the full minimum. For a yearly total, enter your real hours in the annual income calculator.
Hourly Pay vs. Salary: Which Is Better?
Neither hourly pay nor salary is better in every case. The better choice depends on overtime eligibility, unpaid time and benefits. This table compares the two.
| Feature | Hourly pay | Salaried pay |
| Pay basis | Hours worked | Fixed yearly amount |
| Overtime | Usually paid at 1.5x if non-exempt | Often not paid if exempt |
| Income stability | Varies with hours | Steady each period |
| Unpaid time off | Often lowers pay | Often still paid |
| Best for | Shift and part-time work | Predictable schedules |
Hourly workers are usually paid overtime if non-exempt and lose pay for unpaid time off, while salaried exempt workers usually receive a fixed yearly amount and no overtime.
Is hourly or salary better at the same annual figure? Ask four questions:
- Overtime: will you work more than 40 hours a week? Non-exempt hourly pay earns 1.5x for those hours.
- Unpaid time: do you lose pay for sick days or slow weeks? Hourly pay often does.
- Benefits: does either offer add health, retirement or paid leave value? Compare total compensation.
- Stability: do you need the same check every period? Salary gives that.
The salaried overtime calculator covers salaried workers who still qualify for overtime.
Exempt vs. Non-Exempt: The Salary Threshold in Plain English
The U.S. Fair Labor Standards Act (FLSA) sets federal overtime rules. It requires overtime at 1.5 times pay above 40 hours for covered non-exempt workers. Exempt workers are mostly salaried and have no overtime right.
Most white-collar workers are exempt only if they pass three tests. They must be paid on a salary basis, earn at least the minimum salary level and pass a duties test (29 CFR Part 541). In 2026, the federal minimum salary level is $684 a week, which is $35,568 a year. The Department of Labor confirmed that level in May 2026 after courts struck down the 2024 increase. The threshold for highly compensated employees is $107,432 a year.
A salaried worker below the threshold is generally entitled to overtime at 1.5 times the regular rate above 40 hours. Federal law does not require double time. California and some other states do, and California also sets a higher exempt salary level of $1,352 a week for 2026. Salary rules and thresholds change, so check current Department of Labor guidance.
Case Study: Higher Wage or Better Benefits?
Offer A pays $30 an hour for 40 hours, with $6,000 in yearly benefits. Offer B pays $26 an hour for 35 hours, with $14,000 in benefits. Both assume 52 weeks. The effective hourly rate with benefits equals (cash pay + benefits) ÷ hours worked.
| Measure | Offer A | Offer B |
| Cash pay | $62,400 | $47,320 |
| Benefits | $6,000 | $14,000 |
| Total compensation | $68,400 | $61,320 |
| Hours worked per year | 2,080 | 1,820 |
| Total pay per hour | $32.88 | $33.69 |
Offer A totals $68,400, or $32.88 per hour worked. Offer B totals $61,320, or $33.69 per hour worked. Offer A pays $7,080 more per year. Offer B pays more for each hour you work. The better choice depends on whether you value extra income or extra time. Benefits matter too: a $5,000 gap in benefits equals a $2.40 hourly raise at 2,080 hours, and the pay raise calculator shows what a raise of that size does to your yearly pay.
Gross to Net: 2026 Tax Basics
Gross pay is what you earn before deductions. Net pay, or take-home pay, is what you receive after them. Hourly pay is gross pay, so every hourly rate needs a gross-to-net step before it becomes a spending number.
Gross Pay vs. Net Pay
Common deductions include:
- Federal income tax, which is progressive.
- FICA tax, which funds Social Security and Medicare.
- State income tax, where it applies.
- 401(k) contributions, if you choose to save.
- Health insurance premiums.
2026 Tax Facts Used by the Calculator
| Item | 2026 figure |
| Standard deduction, single | $16,100 |
| Standard deduction, married filing jointly | $32,200 |
| Standard deduction, head of household | $24,150 |
| Social Security tax rate | 6.2% |
| Social Security wage base | $184,500 |
| Medicare tax rate | 1.45% |
| Additional Medicare tax | 0.9% above $200,000 (single) or $250,000 (joint) |
| Federal brackets | 10%, 12%, 22%, 24%, 32%, 35%, 37% |
For 2026 the standard deduction is $16,100 for single filers, $32,200 for married filing jointly and $24,150 for head of household. The Social Security wage base is $184,500.
2026 Federal Tax Brackets Used by the Calculator
Source: IRS Revenue Procedure 2025-32, tax year 2026. Rates apply to taxable income, which is income after the standard deduction and pre-tax contributions.
| Rate | Single filer | Married filing jointly | Head of household |
| 10% | $0 to $12,400 | $0 to $24,800 | $0 to $17,700 |
| 12% | $12,400 to $50,400 | $24,800 to $100,800 | $17,700 to $67,450 |
| 22% | $50,400 to $105,700 | $100,800 to $211,400 | $67,450 to $105,700 |
| 24% | $105,700 to $201,775 | $211,400 to $403,550 | $105,700 to $201,750 |
| 32% | $201,775 to $256,225 | $403,550 to $512,450 | $201,750 to $256,200 |
| 35% | $256,225 to $640,600 | $512,450 to $768,700 | $256,200 to $640,600 |
| 37% | Over $640,600 | Over $768,700 | Over $640,600 |
A single filer pays 10% on the first $12,400 of taxable income, 12% on the next $38,000, and so on. Worked example: taxable income of $80,000 (single) = $1,240 + $4,560 + $6,512 = $12,312. That is 15.4% of taxable income, below the 22% marginal rate that the last dollars reach.
Marginal Rate vs. Effective Rate
Your marginal rate is the tax on your last dollar. Your effective rate is your total tax divided by your income.
Many people fear a raise will push them into a bracket that cuts their pay. That does not happen. Only the dollars above each bracket line face the higher rate. This is why a raise never reduces take-home pay by crossing a bracket line. Test the bracket effect with the tax bracket calculator.
Hourly Wage After Taxes: $50,000 and $62,400 Examples
Hourly wage after taxes depends on filing status, state and savings. The two examples below use Card 3 logic for a single filer in Texas with no 401(k) contribution and the $16,100 standard deduction.
| Measure | $50,000 a year ($24.04 an hour) | $62,400 a year ($30 an hour) |
| Taxable income | $33,900 | $46,300 |
| Federal income tax | $3,820 | $5,308 |
| Social Security (6.2%) | $3,100 | $3,869 |
| Medicare (1.45%) | $725 | $905 |
| Take-home pay | $42,355 | $52,318 |
| Monthly take-home | $3,530 | $4,360 |
A $50,000 income leaves about $42,355 after tax, or $3,530 a month. That answers “how much will I take home from $50,000?” for this case. A $30 an hour wage leaves about $52,318 a year, or $4,360 a month. State tax would lower both numbers outside Texas. Use the income tax calculator and the adjusted gross income calculator to see how deductions change the total. Credits are not included; the tax credit calculator covers them.
If your employer gives you a take-home goal, the net to gross calculator works backward. Bonus checks are taxed differently, so see the bonus tax calculator.
Overtime Deduction and Tips Deduction (2025 to 2028)
Two temporary federal deductions may lower income tax for some hourly workers. Both come from the One Big Beautiful Bill Act (Public Law 119-21) and cover tax years 2025 through 2028.
- Qualified overtime deduction: workers may deduct qualified overtime compensation up to $12,500 ($25,000 for joint filers). It covers only the premium half of FLSA-required overtime pay. The deduction phases out above $150,000 of modified adjusted gross income ($300,000 joint).
- Qualified tips deduction: workers in occupations that customarily receive tips may deduct qualified tips up to $25,000. The same $150,000 and $300,000 income phase-outs apply.
Here is how the overtime deduction works in 2026. Since tax year 2026, employers report qualified overtime separately on Form W-2 (Box 12, code TT), and workers generally claim only the reported amount. It reduces income tax, not Social Security or Medicare tax. Employers still withhold tax on overtime unless you update your Form W-4 to account for the deduction. For example, at $28 an hour, the premium half of overtime pay is $14 an hour.
Card 3 does not model either deduction. Use the no tax on overtime calculator and the overtime tax calculator to check your case.
Special Situations and Warnings
Irregular or Seasonal Hours
If your hours change every week, do not use a single weekly number. Hours vary because of seasons, shift swaps and slow periods, and one busy week overstates your year. Add up your total paid hours over the last 12 months. Divide by 52 to find your true weekly average. Example 7 shows the method.
When Hours Are Cut or Overtime Disappears
Annual income falls one-for-one with hours. If the $25 worker from Example 1 drops from 40 to 32 hours, pay falls from $52,000 to $41,600, a loss of $10,400. If the $28 worker from Example 4 loses all overtime, pay falls from $72,800 to $56,000, a drop of 23%. This is why you should budget from regular pay and treat overtime as bonus income.
Part-Time Workers
Part-time pay is easy to overstate. A $20 wage at 20 hours a week pays $20,800 a year, not $41,600. Always enter your real hours. The part-time table above lists common schedules.
Tipped Workers and the Qualified Tips Deduction
The federal minimum cash wage for tipped employees is $2.13 an hour, with tips making up the rest. Many states set higher rates. Enter your average total hourly pay, including tips, for a realistic estimate. The qualified tips deduction can lower federal income tax on up to $25,000 of tips, but it does not remove Social Security, Medicare or state tax.
Self-Employed and Gig Workers
Contractors pay both halves of Social Security and Medicare tax. That self-employment tax is 15.3% on 92.35% of net earnings. Card 3 assumes you are an employee, so it will overstate your take-home pay. Example 9 shows the gap. Track business costs and use the billable hours calculator to price your time.
Multiple Jobs
Add the annual income from each job together. Taxes are based on your total, not on each job alone. Your combined income may push more dollars into higher brackets.
Commission and Mixed Pay
If you earn a base wage plus commission, calculate them separately. Then add them together. The commission calculator helps with the second part.
Long Shifts
Workers on 12-hour shifts often earn overtime in some weeks and not in others. Use the 12 hour shift pay calculator to check your schedule. California has its own overtime rules, covered by the California overtime calculator and the double time pay calculator.
Looking Beyond Annual Income
Nominal vs. Real Wages
A nominal wage is the dollar amount on your paycheck. A real wage adjusts for inflation. If your raise is 2% and inflation is 3%, your real pay fell. Real wage after inflation is the number that shows whether you are really ahead.
Test your own numbers with Card 5. For a standalone view, use the salary inflation calculator or the inflation calculator.
Raises Compound
A 3% raise looks small. Over 10 years, it turns $52,000 into about $69,900. At 2.7% inflation, that is worth about $53,500 in today’s dollars. Your real gain is small, which is why you should push for raises above inflation. At a 3% raise, your pay doubles in about 23.5 years. The percentage change calculator shows the size of any raise as a percent.
Cost of Living and Purchasing Power
A cost-of-living index compares prices across places, with 100 as the U.S. average. Purchasing power is how much your pay buys after those costs.
Here is a simple case. Suppose you take home $50,000 in a state with an index of 90. Your adjusted buying power is about $55,556. In a state with an index of 125, the same pay buys only $40,000 worth of goods.
Saving a Slice of Every Paycheck
In Card 12, a worker earns $52,000, gets 3% raises, saves 10% and earns 7% a year on investments. After 30 years, the fund reaches about $674,000. The worker contributed about $247,000, and growth supplied the rest.
A common guide is the 4% rule. At that rate, $674,000 supports about $26,960 a year. It is a planning guide, not a promise. The compound interest calculator shows how the growth builds.
Budgeting From Take-Home Pay
Budget from take-home pay, not gross pay. The 50/30/20 guide puts 50% toward needs, 30% toward wants and 20% toward savings.
On $45,000 of take-home pay, that means $1,875 a month for needs, $1,125 for wants and $750 for savings. Adjust the split if your rent is high. Use the debt to income ratio calculator before you apply for a loan, and the savings calculator to track your 20%.
How Much Do I Need Per Hour to Afford Rent?
A common guide says rent should stay near 30% of gross monthly income. The hourly wage you need equals monthly rent × 12 ÷ 0.30 ÷ 2,080. For $1,500 of rent, that is $28.85 an hour. For $1,000, it is $19.23. For $2,000, it is $38.46. Landlords usually check gross pay, but your own budget should still use take-home pay. If you plan to buy, the home affordability calculator extends the same logic.
What Is a Good Hourly Wage?
A good hourly wage is one that covers your needs from take-home pay and leaves room to save. No single number fits every place. Costs differ by state, so compare options with Card 11. Then use the Card 6 target rate to find the wage that reaches your goal. For example, if your needs cost $2,400 a month and you want them at 50% of take-home pay, you need $4,800 a month of take-home pay, which is $57,600 a year.
Related Time Conversions
If you work odd schedules, these tools help with the hours behind your pay. Use the weeks to months calculator to turn weeks worked into months, and the days to weeks converter to turn days into weeks. The hours to days converter shows how many working days your hours cover.
For pay totals, the monthly income calculator turns yearly pay into a monthly figure. Use the hourly pay calculator for a quick pay check and the yearly salary calculator when you start from a salary. For partial years, use the prorated salary calculator.
Key Terms Defined
These 16 terms are used throughout the calculator and this guide. You can find more definitions in the Intel Calculator glossary.
| Term | Meaning |
| Gross pay | Earnings before taxes and deductions |
| Net pay | Take-home pay after deductions |
| FICA | The U.S. payroll tax for Social Security and Medicare |
| Standard deduction | A set amount that lowers your taxable income |
| Marginal tax rate | The tax rate on your last dollar |
| Effective tax rate | Total tax divided by total income |
| Exempt employee | A worker not covered by federal overtime rules |
| Non-exempt employee | A worker covered by federal overtime rules |
| Overtime | Extra pay for hours past a set limit |
| Total compensation | Wages plus the value of benefits |
| Nominal wage | Pay in current dollars |
| Real wage | Pay adjusted for inflation |
| Purchasing power | What your income can buy |
| 401(k) | An employer-sponsored retirement savings account |
| Per annum | Per year; annual income is income per annum |
| Annualized pay | A pay rate expressed as a yearly amount |
Methodology, Sources and Version Log
This guide follows named primary sources. Learn how we review content on our editorial policies page and our about page.
- 2026 brackets and standard deductions: IRS Revenue Procedure 2025-32.
- Social Security wage base ($184,500): Social Security Administration 2026 contribution and benefit base announcement.
- Overtime and tipped wages: Fair Labor Standards Act, 29 U.S.C. 207 (overtime) and 29 U.S.C. 203(m) (tipped cash wage).
- Exempt employee rules: Department of Labor, 29 CFR Part 541.
- Overtime and tips deductions: Public Law 119-21 and IRS guidance for tax years 2025 through 2028.
- Federal hourly rate convention (2,087 hours):S. Office of Personnel Management.
Version log. October 2026: verified 2026 deductions, brackets and federal thresholds; corrected the overtime-share wording in Example 4, the bracket wording in Example 5 and the Offer A hourly figure in the case study; added the hours convention, part-time, salary-to-hourly, minimum wage, bracket, take-home and deduction sections. Review cycle: every January and after any IRS, SSA or Department of Labor announcement.
Assumptions and Limitations
This calculator gives estimates. Please keep these limits in mind:
- Card 1 assumes steady hours and a flat hourly rate.
- Taxes use 2026 federal brackets and the standard deduction only. Credits, itemized deductions, local taxes and other income are not included.
- The qualified overtime and tips deductions are not modeled.
- State tax rates and cost-of-living indexes are rounded estimates built into the calculator.
- Card 3 assumes you are an employee, not a contractor.
- Retirement growth assumes a steady return. Real markets rise and fall.
- Overtime and exempt rules differ by state, job type and employer agreement.
Frequently Asked Questions
How do I convert my hourly wage to annual income?
To calculate annual income from an hourly wage, multiply your hourly wage by your weekly hours, then by the weeks you work each year. A full-time worker at $25 an hour earns $25 × 40 × 52, which is $52,000 before taxes.
How much is $20 an hour per year?
At 40 hours a week for 52 weeks, $20 an hour equals $41,600 a year. That is about $3,467 a month before taxes. Fewer hours or unpaid weeks will lower the total.
Why do employers use 2,080 hours in a year?
Payroll uses 2,080 because 40 hours times 52 weeks equals 2,080. It makes comparisons simple. The real number of weekday hours varies slightly, and 2026 has 2,088.
Is annual income gross or net?
Annual income is usually quoted as gross, which is before taxes. Net income is what you keep after taxes and deductions. Hourly pay is gross too. Use the take-home pay card (Card 3) in this calculator to estimate your take-home pay.
How do I turn my hourly rate into a monthly salary?
Find your annual income first, then divide by 12. At $30 an hour, annual pay is $62,400, so monthly pay is $5,200. Do not multiply a weekly check by four, because most months have a little more than four weeks.
Does overtime count toward annual income?
Yes. Overtime pay counts as income once you earn it. Because it can change from year to year, plan your fixed bills around regular pay.
How much is $15 an hour per year?
At 40 hours a week and 52 weeks, $15 an hour equals $31,200 a year. That is $2,600 a month before taxes. The federal minimum of $7.25 an hour equals $15,080 on the same basis.
How accurate is this hourly to salary calculator?
The pay conversions are exact arithmetic based on your inputs. Tax and state figures are estimates and leave out credits, local taxes and other income. Use them for planning, not for filing taxes.
How much is $25 an hour per year?
At 40 hours a week for 52 weeks, $25 an hour equals $52,000 a year before taxes, about $4,333 a month.
How many working hours are in a year?
A standard full-time year has 2,080 paid hours (40 hours times 52 weeks). Some sources use 2,087 hours, and 2026 has 2,088 weekday hours.
What is the difference between wage and salary?
A wage is paid per hour worked and usually earns overtime. A salary is a fixed yearly amount that often does not change with hours.
Is it better to be paid hourly or salary?
Hourly pay suits variable schedules and overtime. Salary suits steady hours and predictable income. Compare total compensation, overtime eligibility and unpaid time off before choosing.
How do I calculate hourly to annual in Excel?
Type =B1B2B3, where B1 is your hourly wage, B2 is hours per week and B3 is weeks worked per year.
How much is the federal minimum wage per year?
At $7.25 an hour and 2,080 hours, the federal minimum wage equals $15,080 a year before taxes.
How many bi-weekly paychecks are in a year?
There are normally 26 bi-weekly paychecks a year. In some calendar years there are 27. In 2026, a bi-weekly schedule gets 27 paydays only if the first payday falls on Thursday, January 1.
Conclusion
Converting an hourly wage to annual income takes one formula: Rate × Hours × Weeks. The result lets you compare jobs, plan a budget and answer questions from lenders and landlords.
This calculator also shows what happens next. It estimates overtime, take-home pay, your true hourly wage, raises, benefits, time off, state costs and retirement savings. Start with Card 1, then let the auto-fill carry your numbers through the other eleven cards. Your next step is the paycheck calculator, which turns your annual income into a per-paycheck number.
Last updated October 2026. This calculator is for informational purposes only and does not constitute professional tax, legal or financial advice. Consult a licensed advisor before making decisions.