
What Is a Balance Sheet?
A balance sheet is the financial document that shows what a company owns, what it owes, and what remains for its owners at a single, specific point in time. It does not measure performance over a period — it captures financial position at one moment, the way a photograph captures a scene. A company with $10 million in assets and $3 million in liabilities holds $7 million in shareholders’ equity, meaning every dollar of the balance sheet is accounted for by either a creditor or an owner.
Unlike the income statement, which records revenues and expenses across a reporting period, or the cash flow statement, which tracks how money moves in and out, the balance sheet answers one foundational question: what is this company worth right now? It is the most fundamental document in financial analysis because every liquidity ratio, leverage ratio, and solvency metric is derived from it.
Use the free balance sheet calculator to analyze your balance sheet data instantly — no sign-up required.
Balance Sheet Definition
A balance sheet is a formal financial statement, prepared under GAAP or IFRS accounting standards, that presents a company’s assets, liabilities, and shareholders’ equity as of a specific reporting date. It is also called the statement of financial position. The document is called a “balance” sheet because its two sides must always be equal: assets on one side, and liabilities plus equity on the other.
The Accounting Equation — The Foundation of Every Balance Sheet
The accounting equation is: Assets = Liabilities + Shareholders’ Equity
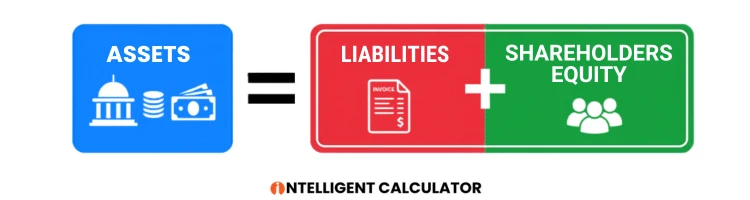
This equation is not a coincidence. It reflects the fundamental reality that every asset a company holds was financed by someone — either a creditor (liability) or an owner (equity). A company that owns a $500,000 building financed with a $300,000 mortgage and $200,000 of its own capital demonstrates this equation exactly: $500,000 in assets equals $300,000 in liabilities plus $200,000 in equity.
The equation must hold true at all times. If a company borrows $1 million, its cash (asset) increases by $1 million and its debt (liability) increases by $1 million — the equation remains balanced. This structural constraint is why accountants call the document a balance sheet.
Balance Sheet vs. Income Statement — What Is the Difference?
The balance sheet shows financial position at a point in time. The income statement shows financial performance over a period of time. These are the two most important differences between them.
The income statement records revenues, expenses, and net profit for a quarter or year. It tells you whether the company made money. The balance sheet records assets, liabilities, and equity on the last day of that same period. It tells you what the company is worth after making or losing that money. They are connected — net profit from the income statement flows into retained earnings on the balance sheet at period end — but they answer different questions.
Balance Sheet vs. Cash Flow Statement — What Is the Difference?
The balance sheet shows total financial position, including non-cash items like depreciation and accounts receivable. The cash flow statement shows only actual cash movements — cash received from operations, cash spent on investments, and cash raised from financing activities.
A company can be profitable on its income statement and have positive equity on its balance sheet while still running out of cash. The cash flow statement reveals this risk. Together, all three statements form a complete picture of financial health; none is sufficient on its own.
Why Is It Called a Balance Sheet?
It is called a balance sheet because the two sides of the document must always balance — that is, be numerically equal. Assets must equal the sum of liabilities and equity. This mathematical equality is enforced by double-entry accounting, where every financial transaction affects at least two accounts simultaneously to keep both sides in equilibrium.
The Three Sections of a Balance Sheet
Every balance sheet contains exactly three sections: assets, liabilities, and shareholders’ equity. These sections are arranged in a standardized order that financial analysts and investors recognize across industries and reporting standards.
Assets
Assets are economic resources controlled by a company that are expected to provide future economic benefit. According to FASB and IASB standards, an item qualifies as an asset only when the company controls the resource, the resource resulted from a past event, and future economic benefit is probable.
Assets are divided into two categories based on how quickly they can be converted to cash: current assets and non-current assets.
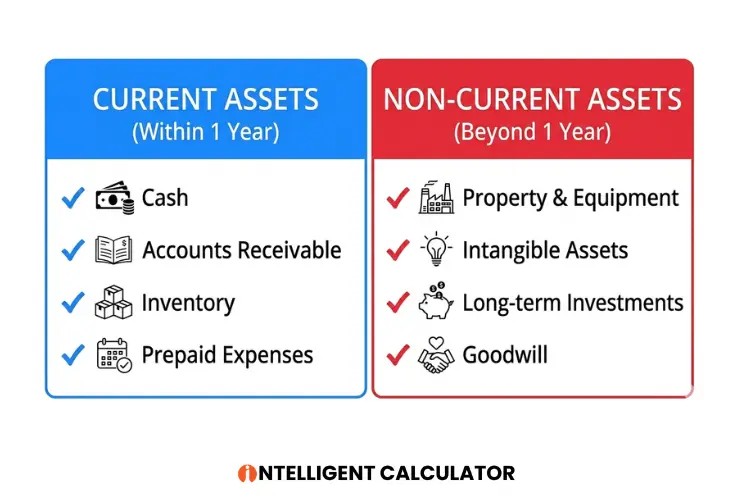
Current Assets — What They Are and What They Include
Current assets are assets expected to be converted into cash, sold, or consumed within one operating cycle or one year, whichever is longer. They appear at the top of the assets section because they represent the most liquid resources the company holds.
Current assets typically include cash and cash equivalents, short-term investments, accounts receivable, inventory, and prepaid expenses. Cash and cash equivalents are the most liquid. Accounts receivable represents money owed by customers for goods or services already delivered. Inventory represents goods held for sale or materials used in production.
The total of current assets is used to calculate the current ratio, one of the most widely used measures of short-term financial health. Use the free current ratio calculator to measure your liquidity position instantly.
Non-Current Assets — What They Are and What They Include
Non-current assets are assets expected to provide economic benefit beyond one year. They are also called long-term assets or fixed assets. They represent the company’s long-term investment in its own productive capacity.
Non-current assets include property, plant, and equipment (PP&E), intangible assets such as patents and trademarks, long-term investments, goodwill from acquisitions, and right-of-use assets under lease accounting. PP&E is reported at historical cost minus accumulated depreciation. Goodwill appears only when one company acquires another at a price above the fair value of its net identifiable assets.
Liabilities
Liabilities are present obligations of a company arising from past events, the settlement of which is expected to result in an outflow of economic resources. Simply stated, liabilities are what the company owes to others — suppliers, lenders, employees, and governments.
Liabilities are divided into current liabilities and non-current liabilities based on the timeline of their expected settlement.
Current Liabilities — What They Are and What They Include
Current liabilities are obligations expected to be settled within one year or one operating cycle. They represent the company’s short-term financial commitments that must be honored with current assets or by creating new short-term obligations.
Current liabilities typically include accounts payable, accrued expenses, short-term debt, the current portion of long-term debt, deferred revenue, and income taxes payable. Accounts payable represents amounts owed to suppliers. Deferred revenue represents payments received from customers for goods or services not yet delivered.
Non-Current Liabilities — What They Are and What They Include
Non-current liabilities are obligations that extend beyond one year. They represent the company’s long-term financial commitments — debt that does not need to be repaid immediately, obligations under pension plans, and deferred tax liabilities.
Non-current liabilities typically include long-term debt, bonds payable, pension obligations, and deferred tax liabilities. Long-term debt is the most significant non-current liability for capital-intensive companies. The ratio of long-term debt to total equity — the debt-to-equity ratio — is a primary measure of financial leverage used by credit analysts.
Shareholders’ Equity
Shareholders’ equity is the residual interest in a company’s assets after all liabilities have been deducted. It represents the net worth of the company from the owners’ perspective — the amount that would theoretically remain for shareholders if all assets were liquidated at book value and all liabilities were paid.
Shareholders’ equity equals total assets minus total liabilities. This relationship is a direct restatement of the accounting equation.
What Is Included in Shareholders’ Equity?
Shareholders’ equity includes common stock, additional paid-in capital, retained earnings, accumulated other comprehensive income or loss, and treasury stock.
Common stock represents the par value of shares issued. Additional paid-in capital represents the amount investors paid above par value when shares were issued. Retained earnings are the cumulative net profits the company has earned and reinvested rather than distributed as dividends. Treasury stock is the value of shares the company has repurchased from the open market, recorded as a deduction from total equity.
Use the free shareholders equity calculator to calculate your complete equity position — including contributed capital, retained earnings, and treasury stock components.
How to Read a Balance Sheet
Reading a balance sheet means extracting the financial story it tells — not simply confirming that assets equal liabilities plus equity. A trained analyst reads the balance sheet in a specific sequence, evaluating size, structure, and stability before calculating any ratios. Learn the complete step-by-step framework in our dedicated guide on how to read a balance sheet.
Start With Total Assets — The Size of the Business
Total assets reveal the scale of the business. A company with $500 million in total assets operates at a fundamentally different scale than one with $5 million, regardless of profitability. Growth in total assets over successive balance sheets signals expansion. Shrinkage signals contraction or deliberate asset disposal.
Compare total assets to total revenue — this produces the asset turnover ratio, which measures how efficiently the company generates revenue from its asset base. Capital-intensive industries like manufacturing and utilities report lower asset turnover than asset-light businesses like software.
Check the Liability Structure — Short-Term vs. Long-Term
After assessing size, examine the liability structure. A company with $100 million in total liabilities, of which $80 million matures within 12 months, faces significantly more immediate financial risk than one whose $100 million in liabilities are all long-term debt due in 10 years.
Calculate the current ratio — current assets divided by current liabilities — to evaluate whether short-term assets are sufficient to cover short-term obligations. A current ratio below 1.0 indicates that the company cannot cover its near-term debts with its near-term assets, which is a warning signal for creditors.
Analyze Shareholders’ Equity — The Owner’s Stake
Shareholders’ equity reveals how much of the company the owners actually own, versus how much is financed by debt. Positive and growing equity generally indicates financial strength. Negative equity — where liabilities exceed assets — can indicate insolvency, though it does not automatically mean the company is failing.
Retained earnings within equity deserves specific attention. Large accumulated retained earnings indicate a profitable history where management has chosen to reinvest profits rather than distribute them. Negative retained earnings, called an accumulated deficit, indicate cumulative losses.
Verify the Accounting Equation Balances
Confirm that total assets equal total liabilities plus total shareholders’ equity. On a properly prepared balance sheet, these figures will always be equal. If they do not balance, there is an error in the financial statements.
This verification step, while simple, is the first quality check any analyst performs before proceeding with ratio analysis.
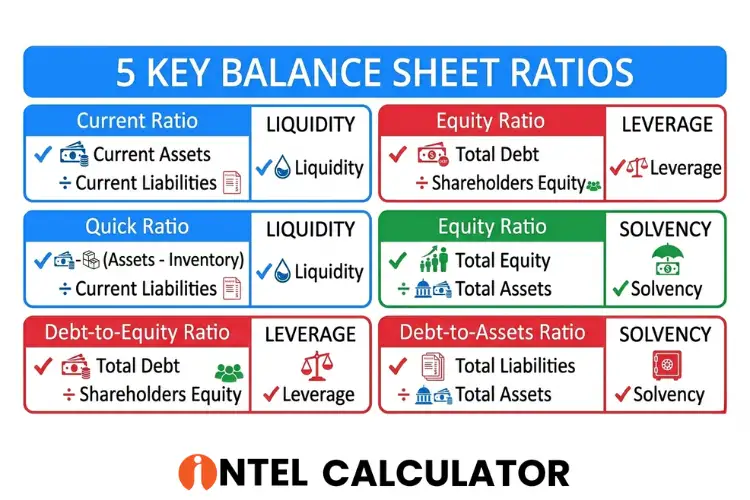
Calculate the Five Key Ratios From the Balance Sheet
Five ratios derived directly from balance sheet data are the standard starting point for financial analysis: the current ratio (current assets ÷ current liabilities), the quick ratio ((current assets − inventory) ÷ current liabilities), the debt-to-equity ratio (total debt ÷ shareholders’ equity), the equity ratio (equity ÷ total assets), and the debt-to-assets ratio (total liabilities ÷ total assets).
Each ratio answers a specific question about liquidity, leverage, or solvency. No single ratio provides a complete picture; they must be read together and compared against industry benchmarks. Use the free current ratio calculator to measure your liquidity position instantly.
Real Company Balance Sheet Example
To make balance sheet analysis concrete, consider Meridian Industrial Corp., a mid-size manufacturer with the following simplified financial position at December 31:
Simplified Balance Sheet Format
| Meridian Industrial Corp. — Balance Sheet | December 31 |
| ASSETS | |
| Cash and cash equivalents | $2,400,000 |
| Accounts receivable | $3,800,000 |
| Inventory | $4,100,000 |
| Prepaid expenses | $300,000 |
| Total Current Assets | $10,600,000 |
| Property, plant & equipment (net) | $14,200,000 |
| Intangible assets | $1,800,000 |
| Total Non-Current Assets | $16,000,000 |
| Total Assets | $26,600,000 |
| LIABILITIES | |
| Accounts payable | $2,100,000 |
| Accrued expenses | $900,000 |
| Current portion of long-term debt | $600,000 |
| Total Current Liabilities | $3,600,000 |
| Long-term debt | $8,400,000 |
| Deferred tax liabilities | $700,000 |
| Total Non-Current Liabilities | $9,100,000 |
| Total Liabilities | $12,700,000 |
| SHAREHOLDERS’ EQUITY | |
| Common stock | $1,000,000 |
| Additional paid-in capital | $4,900,000 |
| Retained earnings | $8,000,000 |
| Total Shareholders’ Equity | $13,900,000 |
| Total Liabilities + Equity | $26,600,000 |
Reading the Assets Section — Line by Line
Meridian holds $2.4 million in cash — immediately available liquidity. Accounts receivable of $3.8 million represents money already earned but not yet collected from customers, indicating healthy sales activity. Inventory of $4.1 million is the largest current asset, typical for a manufacturer, and represents goods in production or ready for sale.
Total current assets of $10.6 million against total current liabilities of $3.6 million produces a current ratio of 2.94x — well above the 1.5x–2.0x range considered healthy for manufacturers, suggesting strong short-term liquidity.
Reading the Liabilities Section — Line by Line
Total liabilities of $12.7 million consist primarily of long-term debt ($8.4 million), indicating that Meridian relies on long-term financing rather than short-term borrowing. Only $600,000 of its debt matures within the current year, reducing near-term repayment pressure.
The debt-to-equity ratio is 0.91x ($12.7M ÷ $13.9M), meaning Meridian carries slightly less debt than equity — a moderate leverage position comfortable for a capital-intensive manufacturer.
Reading the Equity Section — Line by Line
Shareholders’ equity of $13.9 million is driven primarily by retained earnings of $8 million, indicating that Meridian has accumulated significant profits over its operating history and reinvested them rather than distributing all earnings as dividends.
Additional paid-in capital of $4.9 million reflects the premium investors paid above par value when purchasing Meridian shares — a measure of investor confidence in the business at the time of capital raises.
What This Balance Sheet Tells an Investor in 60 Seconds
Meridian Industrial Corp. is a mid-size manufacturer with a strong liquidity position (current ratio 2.94x), moderate leverage (debt-to-equity 0.91x), and a history of profitability evidenced by $8 million in retained earnings. The balance sheet signals financial stability, adequate short-term resources, and a long-term asset base consistent with a capital-intensive business. A credit analyst would approve standard lending; an equity investor would look next to the income statement to evaluate how efficiently Meridian generates returns from this asset base.
Types of Balance Sheets
Classified Balance Sheet
A classified balance sheet groups assets and liabilities into subcategories — current and non-current — making it easier for readers to assess liquidity. This is the most common format used by publicly traded companies under both GAAP and IFRS. The classification system allows analysts to calculate liquidity ratios directly from the document.
Unclassified Balance Sheet
An unclassified balance sheet lists all assets and all liabilities without separating them into current and non-current categories. It is less common and typically used by smaller businesses, professional service firms, or in specific regulatory filings. The lack of classification makes ratio analysis more difficult.
Comparative Balance Sheet
A comparative balance sheet presents data from two or more reporting periods side by side — typically the current year and the prior year. This format is required for public company filings under SEC rules. It enables trend analysis, allowing analysts to identify whether assets are growing, liabilities are accumulating, or equity is building over time.
Common-Size Balance Sheet
A common-size balance sheet expresses every line item as a percentage of total assets rather than in absolute dollars. This format is used for cross-company comparison, because it eliminates size differences between companies. If Company A holds 40% of its assets in inventory and Company B holds 15%, the common-size format makes this structural difference immediately visible regardless of each company’s absolute asset value.
Consolidated Balance Sheet
A consolidated balance sheet combines the financial position of a parent company with all its subsidiaries into a single unified statement. It eliminates intercompany transactions and balances to present the economic entity as a whole. Apple Inc., for example, does not publish separate balance sheets for each of its subsidiaries — it publishes one consolidated balance sheet representing the entire corporate group.
Why the Balance Sheet Matters
For Investors Evaluating Financial Health
Investors use the balance sheet to determine whether a company can survive a financial downturn, how much debt it carries relative to its equity, and whether it holds sufficient liquid assets to meet near-term obligations. The balance sheet is the document that separates companies that appear profitable from companies that are genuinely financially sound.
A company can report strong net income on its income statement while quietly accumulating dangerous levels of debt on its balance sheet. Without reading the balance sheet, no investor can assess this risk accurately.
For Business Owners Making Strategic Decisions
Business owners use the balance sheet to understand their company’s true financial position before making major decisions — expanding capacity, acquiring a competitor, or returning capital to shareholders. When a business owner sees that current liabilities are approaching current assets, it is a signal to prioritize cash generation over growth. When retained earnings are strong and debt is low, it may signal capacity for strategic investment.
For Lenders Approving Loans
Lenders require the balance sheet as the primary document in any credit assessment. Debt service coverage, collateral value, leverage ratios, and working capital adequacy are all evaluated directly from balance sheet data. A company applying for a $5 million loan will have its balance sheet analyzed to determine whether its assets provide adequate collateral and whether existing liabilities leave room for additional debt service.
For Accountants and Auditors
Accountants use the balance sheet as the verification document that confirms all recorded transactions are properly classified and that the accounting equation holds. Auditors trace balance sheet figures back to source documents — bank statements, asset registries, loan agreements — to verify that every figure accurately represents real economic activity. A balance sheet that does not balance indicates an unresolved error in the accounting records.
Balance Sheet Under GAAP vs. IFRS
Key Differences in Asset Classification
Under US GAAP, assets are listed in order of liquidity — most liquid first, with current assets preceding non-current assets. Under IFRS, companies may list assets in reverse order of liquidity — non-current assets first, followed by current assets — though the classified structure is still required.
Inventory valuation rules also differ. GAAP permits the LIFO (Last In, First Out) method, which can reduce the carrying value of inventory during periods of rising prices. IFRS prohibits LIFO, requiring companies to use FIFO or weighted average cost instead. This difference can produce materially different inventory balances for the same underlying stock.
Key Differences in Liability Presentation
GAAP and IFRS handle lease obligations differently following the introduction of ASC 842 and IFRS 16 respectively. Both standards now require most leases to be recognized on the balance sheet as right-of-use assets and lease liabilities. However, the criteria for classifying leases as operating versus finance leases differ between the two standards, producing different balance sheet presentations for identical lease contracts.
Development costs for internally generated intangible assets are capitalized under IFRS if specific criteria are met, and expensed immediately under GAAP. This means an IFRS balance sheet may show higher intangible assets than an equivalent GAAP balance sheet for the same company.
Which Standard Applies to Your Business?
US GAAP applies to all companies listed on US stock exchanges, including subsidiaries of foreign companies listed in the United States. IFRS is required in over 140 countries, including all EU member states, the UK, Australia, and Canada. Private companies in the United States are not required to follow GAAP but often adopt it for investor and lender reporting purposes.
How to Use the Balance Sheet Calculator
Enter Your Balance Sheet Data
Enter your company’s total current assets, total non-current assets, total current liabilities, total non-current liabilities, and total shareholders’ equity into the designated fields. The calculator accepts figures in any currency — the outputs are ratios and relative comparisons that are currency-neutral.
Get Instant Ratio Analysis
The calculator instantly computes all major balance sheet ratios — current ratio, quick ratio, debt-to-equity ratio, equity ratio, debt-to-assets ratio, working capital, and more — from the data you enter. Each ratio is displayed with its formula, its calculated value, and a plain-English interpretation of what the number means for your specific financial position.
Compare Against Industry Benchmarks
Select your industry from the dropdown to compare your ratios against sector-specific benchmarks. A debt-to-equity ratio of 2.0x is standard in utilities and real estate, where high leverage is structurally expected, but would signal dangerous overleveraging in a software company. Context is everything in ratio analysis.
Use our free Balance Sheet Calculator to instantly calculate all financial ratios from your balance sheet data — liquidity, leverage, profitability, and solvency in one dashboard.
Final Thoughts
The balance sheet is not a compliance document. It is the most honest picture of a company’s financial reality available to any reader — investor, lender, manager, or analyst. Every claim about a company’s strength or weakness must eventually be tested against the balance sheet. Revenues can be recognized aggressively; cash flows can be managed through timing; but the balance sheet accumulates the consequences of every financial decision a company has ever made.
Understanding the balance sheet — its structure, its ratios, and its limitations — is the foundation of financial literacy for anyone who works with, invests in, or manages a business.
Use the free balance sheet calculator to analyze your complete financial position — all ratios, all sections, instantly.
Frequently Asked Questions
What is a balance sheet in simple terms?
A balance sheet is a financial document that shows what a company owns (assets), what it owes (liabilities), and what belongs to its owners (equity) at a specific date. It provides a snapshot of financial position at one moment in time.
What are the three main sections of a balance sheet?
The three sections are assets, liabilities, and shareholders’ equity. Assets appear first, followed by liabilities, and finally shareholders’ equity. The sum of liabilities and equity must equal total assets.
What is the balance sheet equation?
The balance sheet equation is: Assets = Liabilities + Shareholders’ Equity. This equation must always hold true because every asset is financed by either a creditor (liability) or an owner (equity).
How is a balance sheet different from an income statement?
A balance sheet shows financial position at a point in time — what the company owns and owes on a specific date. An income statement shows financial performance over a period — revenues, expenses, and net profit for a quarter or year. They are complementary documents that together describe a company’s financial reality.
How often is a balance sheet prepared?
Publicly traded companies prepare balance sheets quarterly and annually as required by SEC regulations. Private companies typically prepare balance sheets annually, though monthly or quarterly preparation is common for management reporting and lender compliance.
What does a balance sheet tell you about a company?
A balance sheet reveals a company’s liquidity (ability to meet short-term obligations), leverage (amount of debt relative to equity), asset structure (the mix of current and long-term assets), and overall net worth. It answers whether the company is financially stable at the moment of reporting.
What is included in shareholders’ equity on a balance sheet?
Shareholders’ equity includes common stock (par value of shares issued), additional paid-in capital (amount paid above par value), retained earnings (cumulative net profits reinvested in the business), accumulated other comprehensive income or loss, and treasury stock (shares repurchased, recorded as a deduction).
What is a consolidated balance sheet?
A consolidated balance sheet combines the financial position of a parent company and all its subsidiaries into a single statement, eliminating intercompany transactions. It represents the entire corporate group as one economic entity rather than reporting each legal entity separately.
This guide is part of Intelligent Calculator’s Financial Statement knowledge hub — covering balance sheet analysis, accounting principles, financial ratios, and FASB reporting standards. Free calculators included.


